This collection of simple shell script, a bit of duckdb SQL and gnuplot that generates some nice, and simple summary graphs of Microsoft Teams Live attendance by extracting data from the Attendee Report CSV that you can download from the Teams after the event is over.
Currently generates graphs for
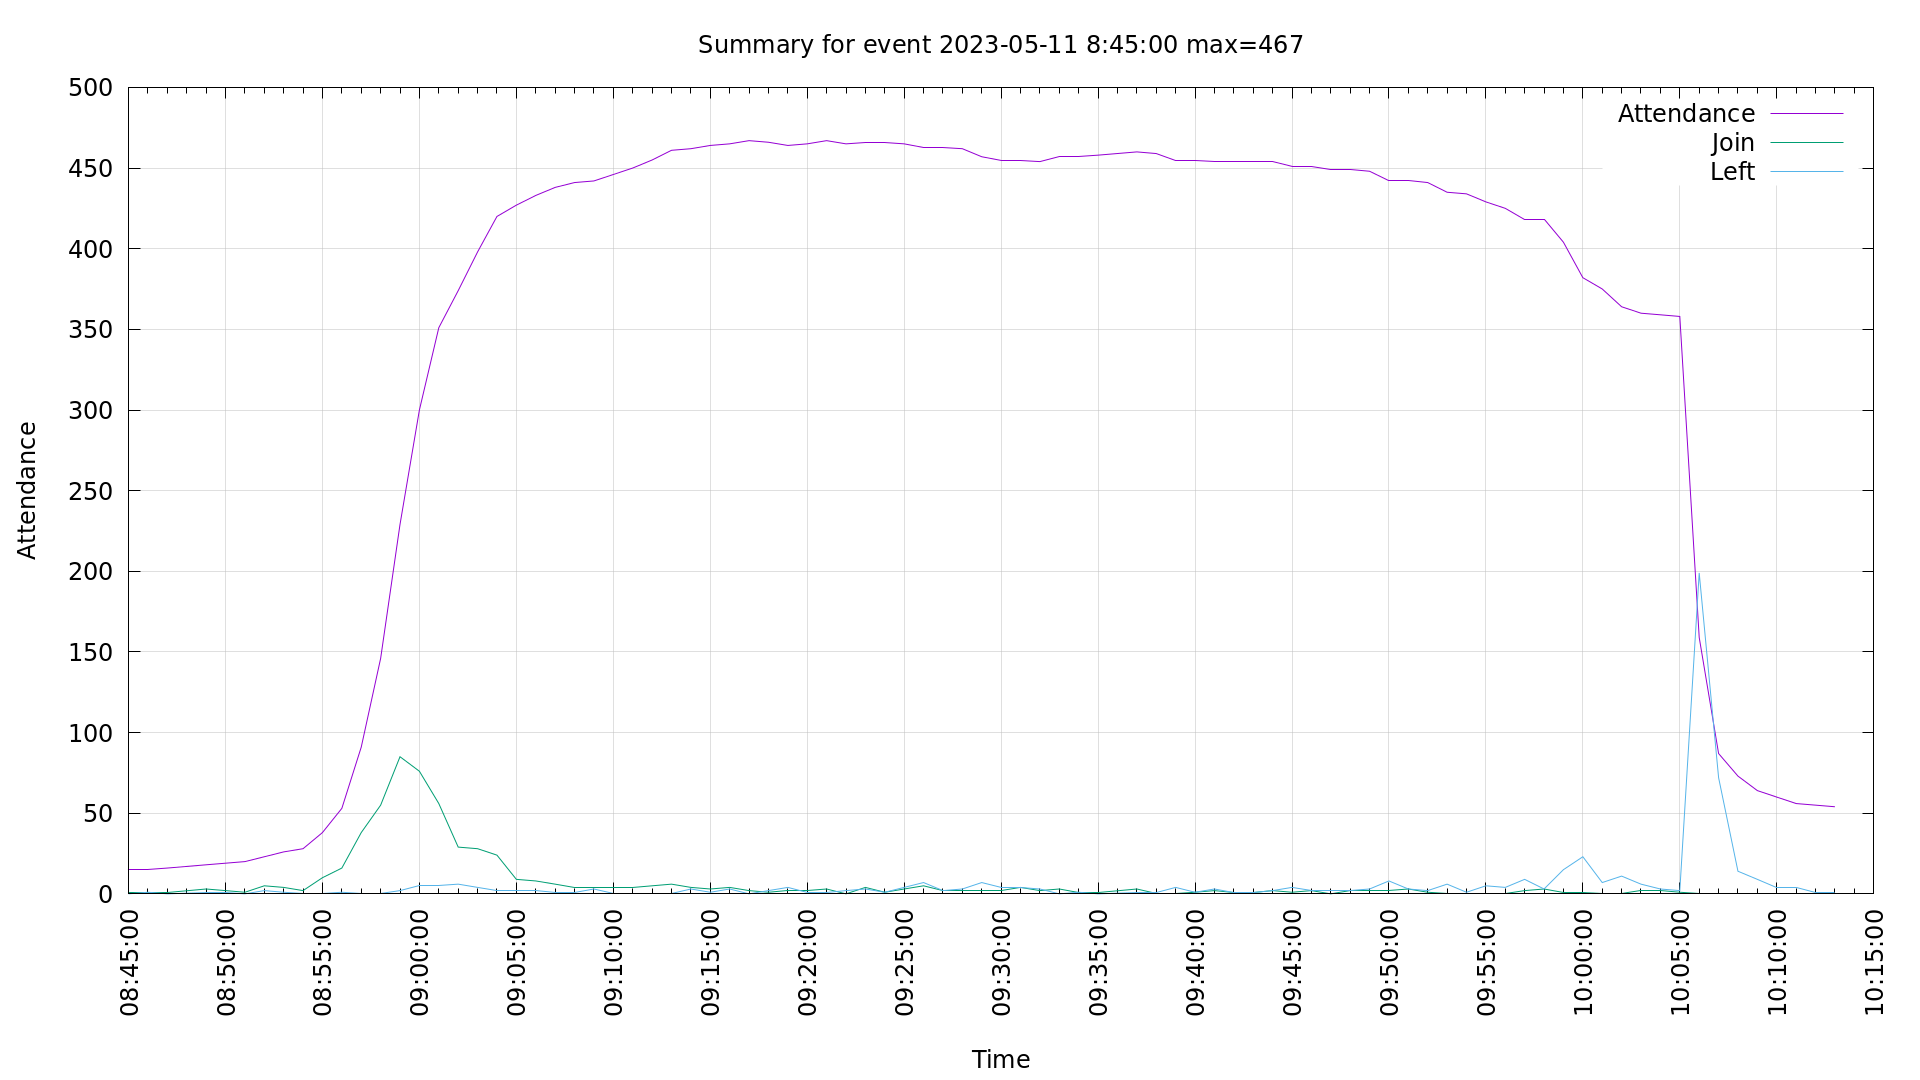
- Attendance, Joins and Leaving over time (1 minute buckets), max amount attendees
- Attendee domains with counts
As an extra you will also get csv files of the above for any extra analysis.
Requirements
Funnily enough, a Linux/Unix environment with some basic tools, most of these can be found from you package repository, and if not, is just a simple compile away (mainly duckdb)
- bash
- gnuplot
- duckdb
- If using Windows, then Windows Subsystem for Linux with Linux distribution of choice makes life easier
Bugs and issues
For now, events that overlap are NOT supported in the same attendee database.
Images
Image
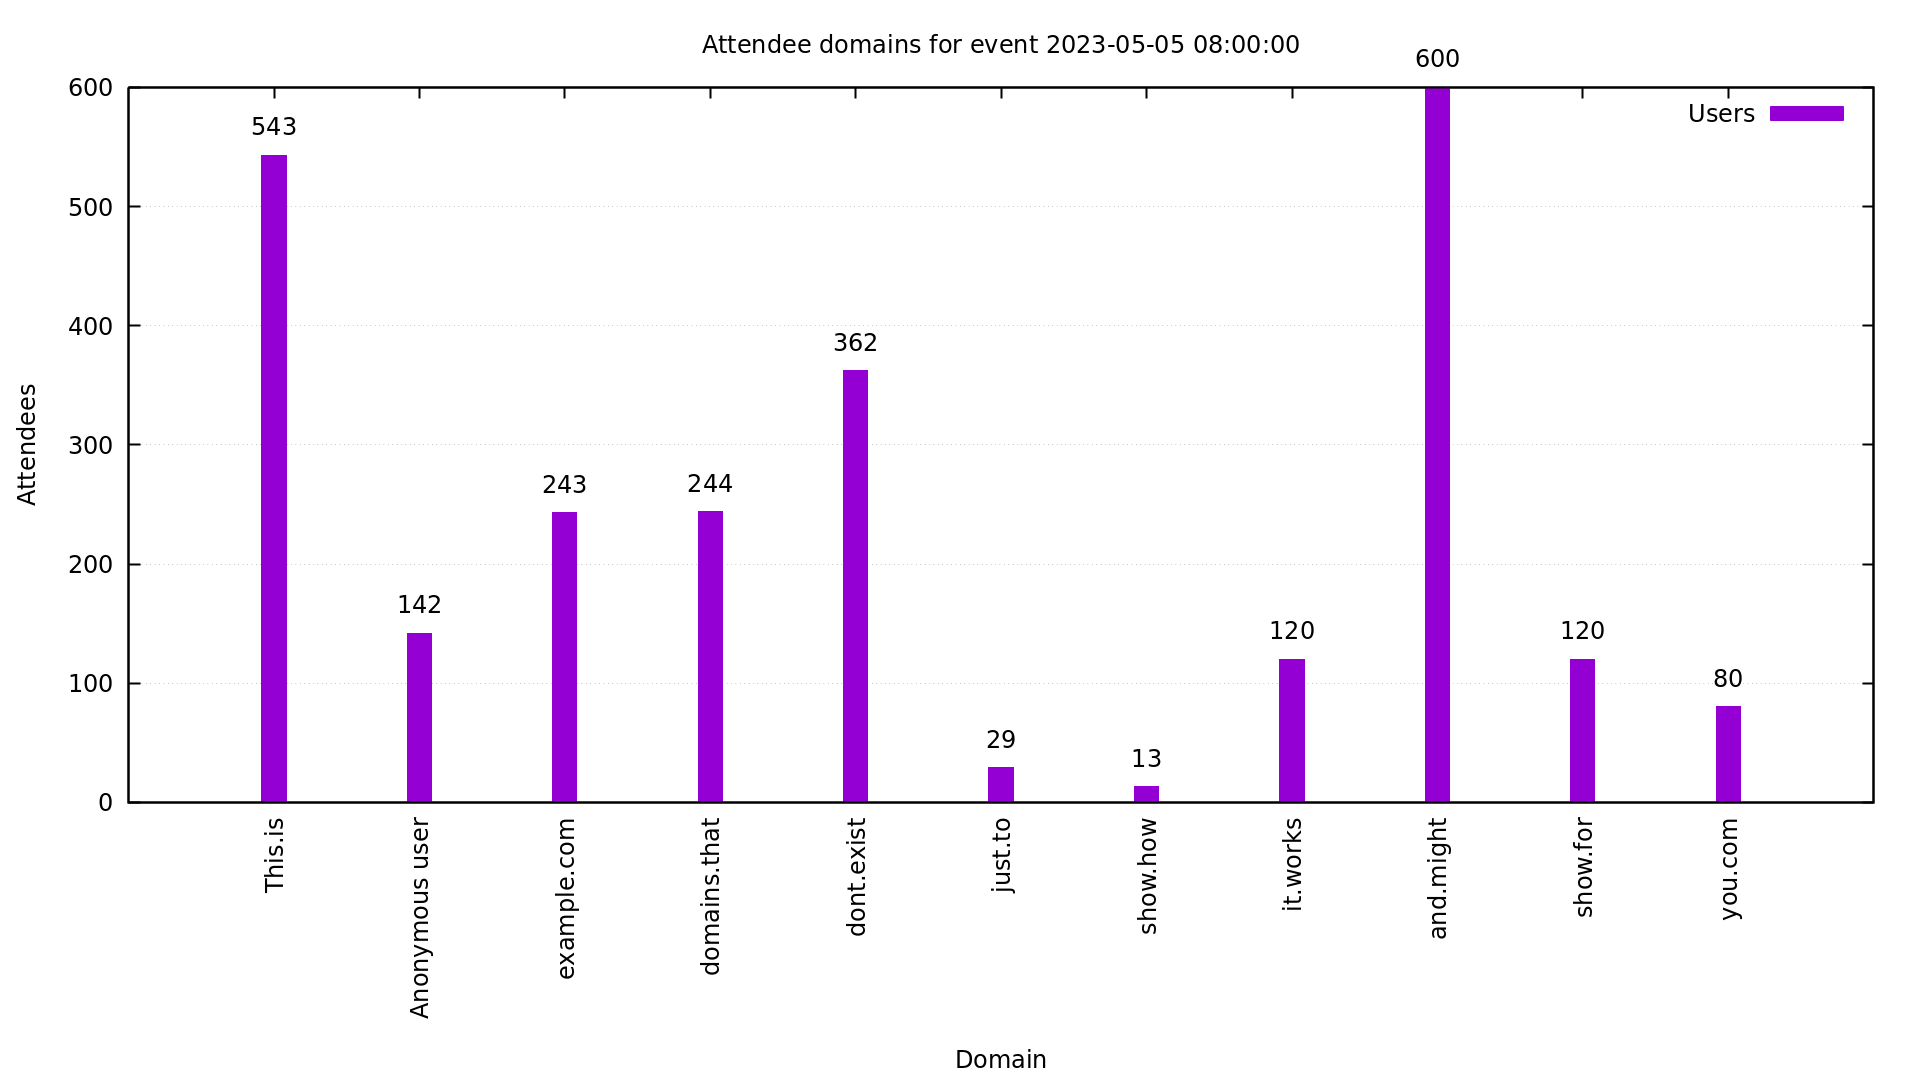
Image